Xan Gregg
A small collection of tools and experiments. Blog: rawdatastudies.com. Social: xangregg.bsky.social.
-
Comma,Comma
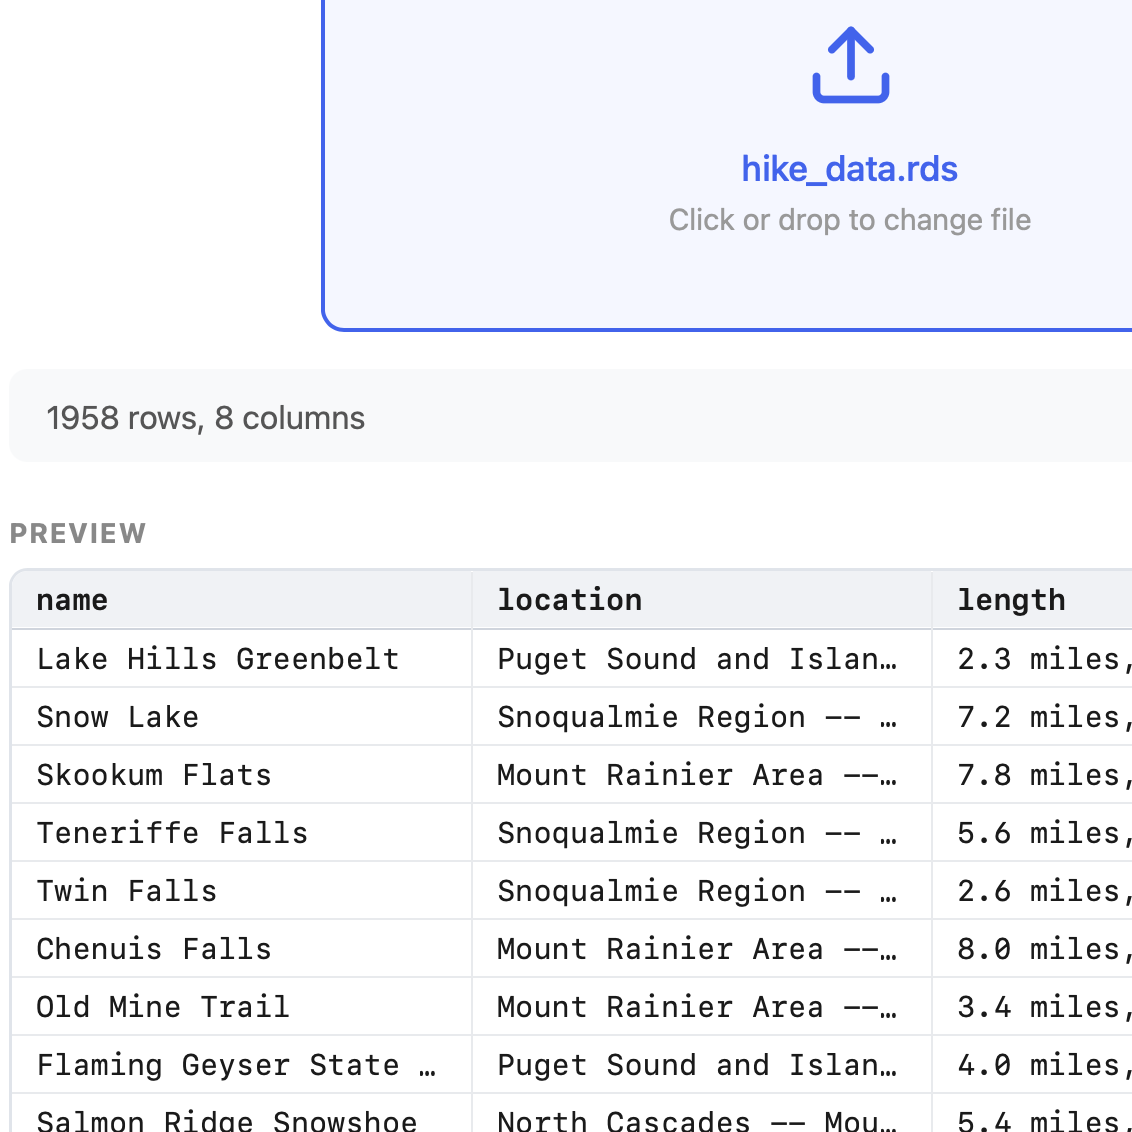
A browser-based tabular data format converter. Provide data in one format and get CSV or another format out. Mainly useful for converting R data frames.
-
Steepest Road in Town
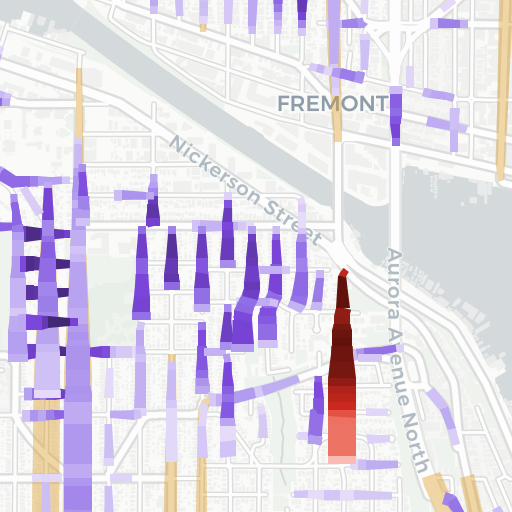
Enter a location and find the steepest roads nearby, ranked and color-coded and with a few options for how steepness is defined.
-
Data Strips
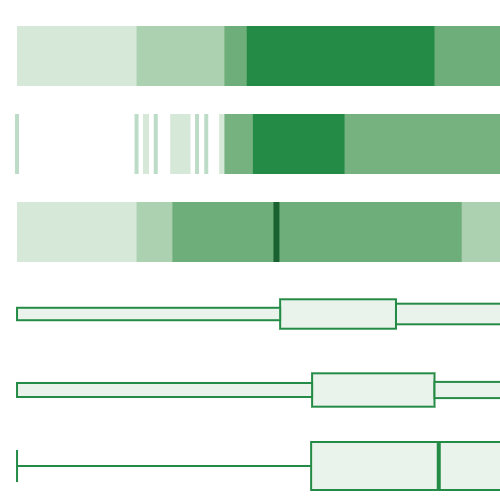
An interactive playground for comparing one-dimensional distribution summaries. Includes box plots, rugs, density-style bands, and new variants based on shortest half.
-
Loess Regression Robustness Flaw
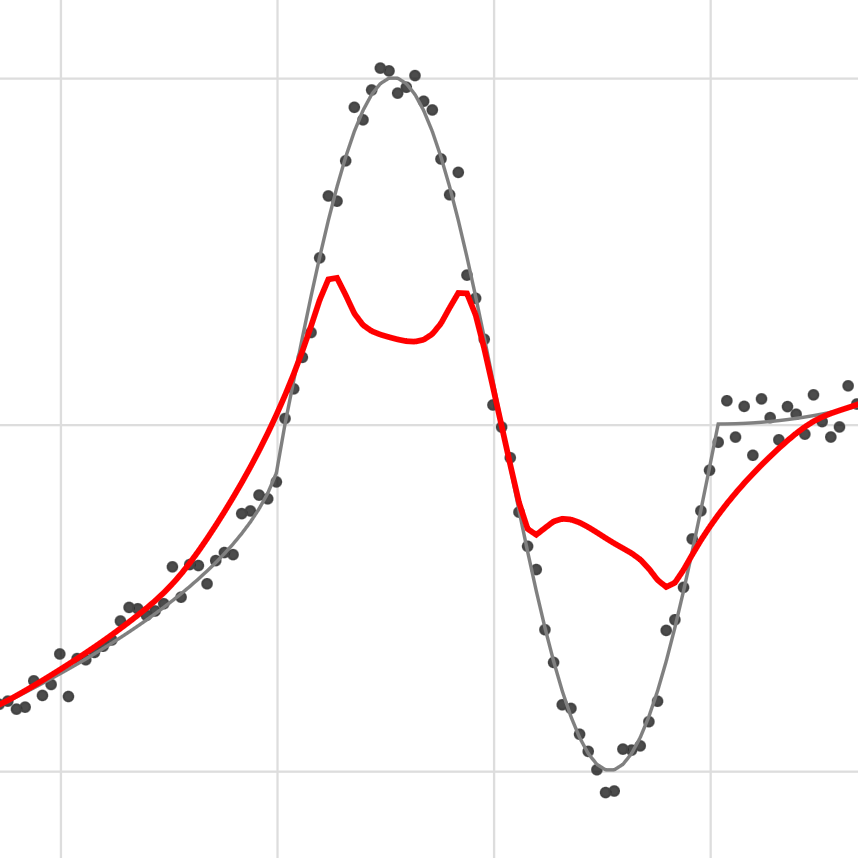
An interactive demonstration of a minor flaw in robust loess regression which occurs when the original data is already very smooth. In that case, the usual robustness passes can create artifacts in the data.
-
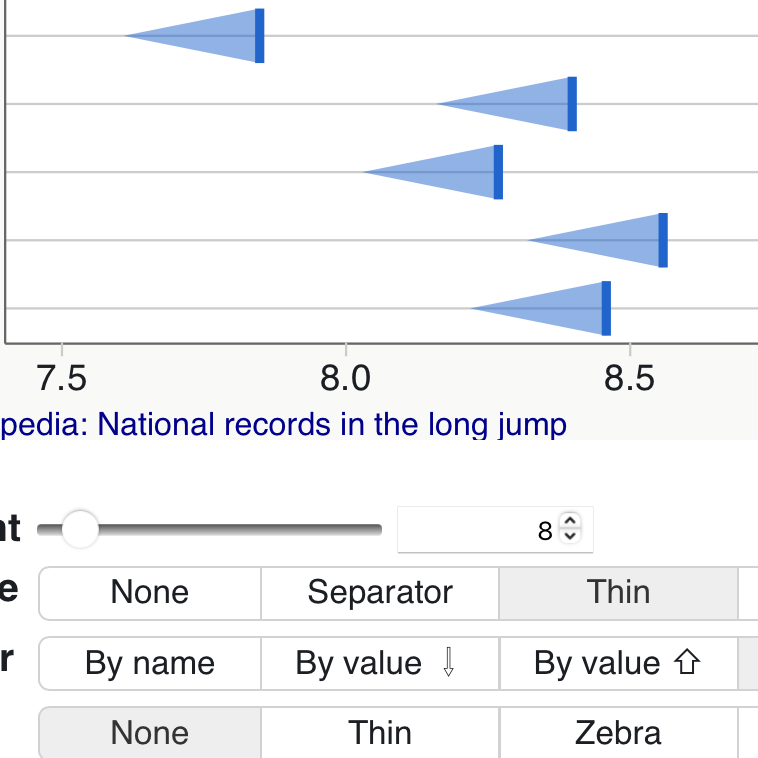
Dot Plot Workbench
An interactive workbench to experiment with several dot plot variations.
-
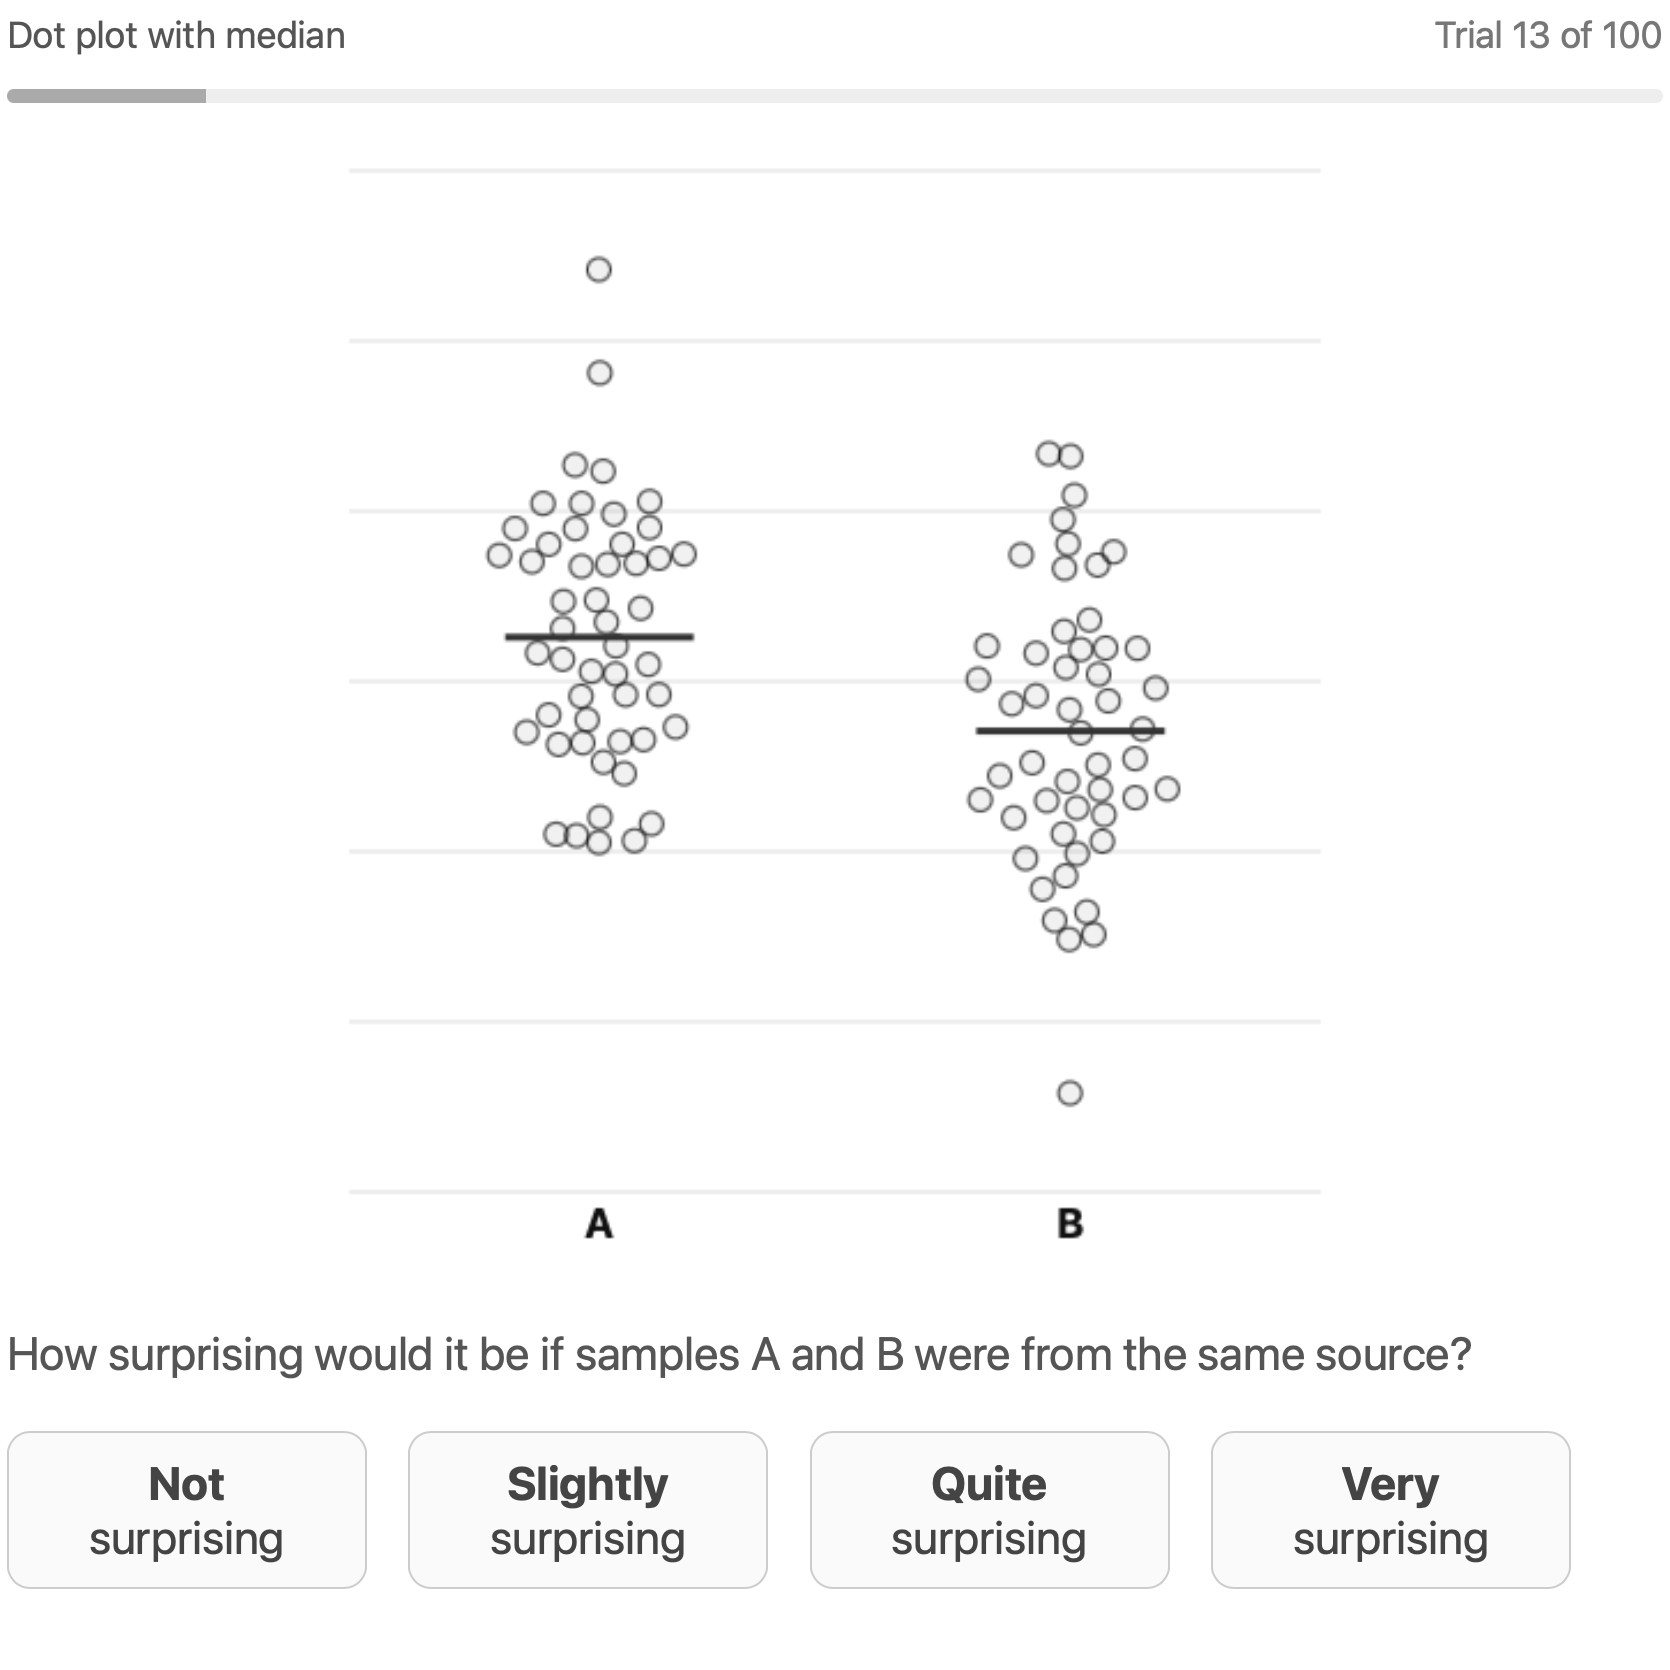
Paired Distributions Survey
A survey to compare distribution visualizations. Participants judge which of two paired charts better reveals differences between two distributions.